Deoptimize Your Snapshots Now in Snapshot Debugger
Have You Tried Snapshot Debugger Yet? No? Why Not?
If you don't know by now, I am a huge fan of [Snapshot Debugger](https://docs.microsoft.com/azure/azure-monitor/app/snapshot-debugger), which if you are not aware is a tool that allows .NET developers to get better visibility into their remote applications. Snapshot Debugger is accessible via 2 locations, the Azure Portal (Product Name is Application Insights Snapshot Debugger), where you can see variables in your call stack like so.
Snapshot Debugger is also built into Visual Studio Enterprise (Product Name is Visual Studio SnapshotDebugger, man naming is hard 😊) so be sure to ask your boss for it if you don't have it. You can access this feature by downloading a snapshot from the Azure Portal (the extension is .diagsession) and opening it with Visual Studio. With Snapshot Debugger, you have the ability to view, key information related to exceptions that your application is throwing, which quickens the time to triage and eventually solve your problem. I have talked about on [Channel 9](https://www.youtube.com/watch?v=Ug2ZO5zbYmc), and spoken at numerous conferences about how it is a must-have tool for every .NET developer on the planet.
Current Limitations
Right now, there is a considerable limitation with Snapshot Debugger. To not affect performance of apps, by default code is optimized when snapshots are generated, what does this mean? It means that your ability to view certain variables is taken away. This severely limits our ability as developers to get the full view of an exception that happens. But there has recently been help from the Product Group in this area.
Configurable Deoptimization
Beginning in version `1.3.5-pre-1906.403`(preview release) of `Microsoft.ApplicationInsights.SnapshotCollector`, a setting was added to the `SnapshotCollectorConfiguration` node called *DeoptimizeMethodCount*.
1 "SnapshotCollectorConfiguration": {
2 "DeoptimizeMethodCount": 1,
3 "IsEnabledInDeveloperMode": false,
4 "ThresholdForSnapshotting": 5,
5 "MaximumSnapshotsRequired": 3,
6 "MaximumCollectionPlanSize": 50,
7 "ReconnectInterval": "00:15:00",
8 "ProblemCounterResetInterval": "1.00:00:00",
9 "SnapshotsPerTenMinutesLimit": 1,
10 "SnapshotsPerDayLimit": 30,
11 "SnapshotInLowPriorityThread": true,
12 "ProvideAnonymousTelemetry": true,
13 "FailedRequestLimit": 3
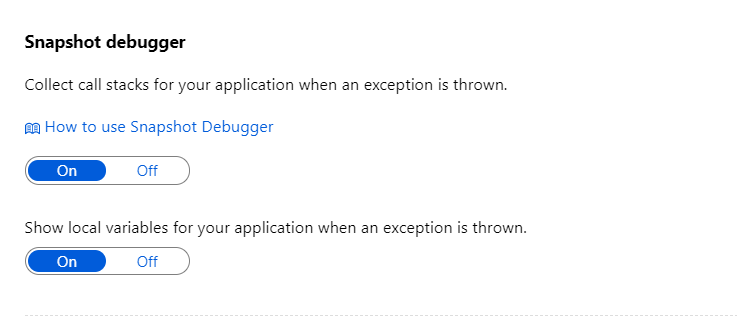
14 }This setting allows developers to configure the level of deoptimization suitable for their apps. To enable deoptimization, be sure to enable Snapshot Debugger call stacks and local variable support from the Application Insights configuration page.
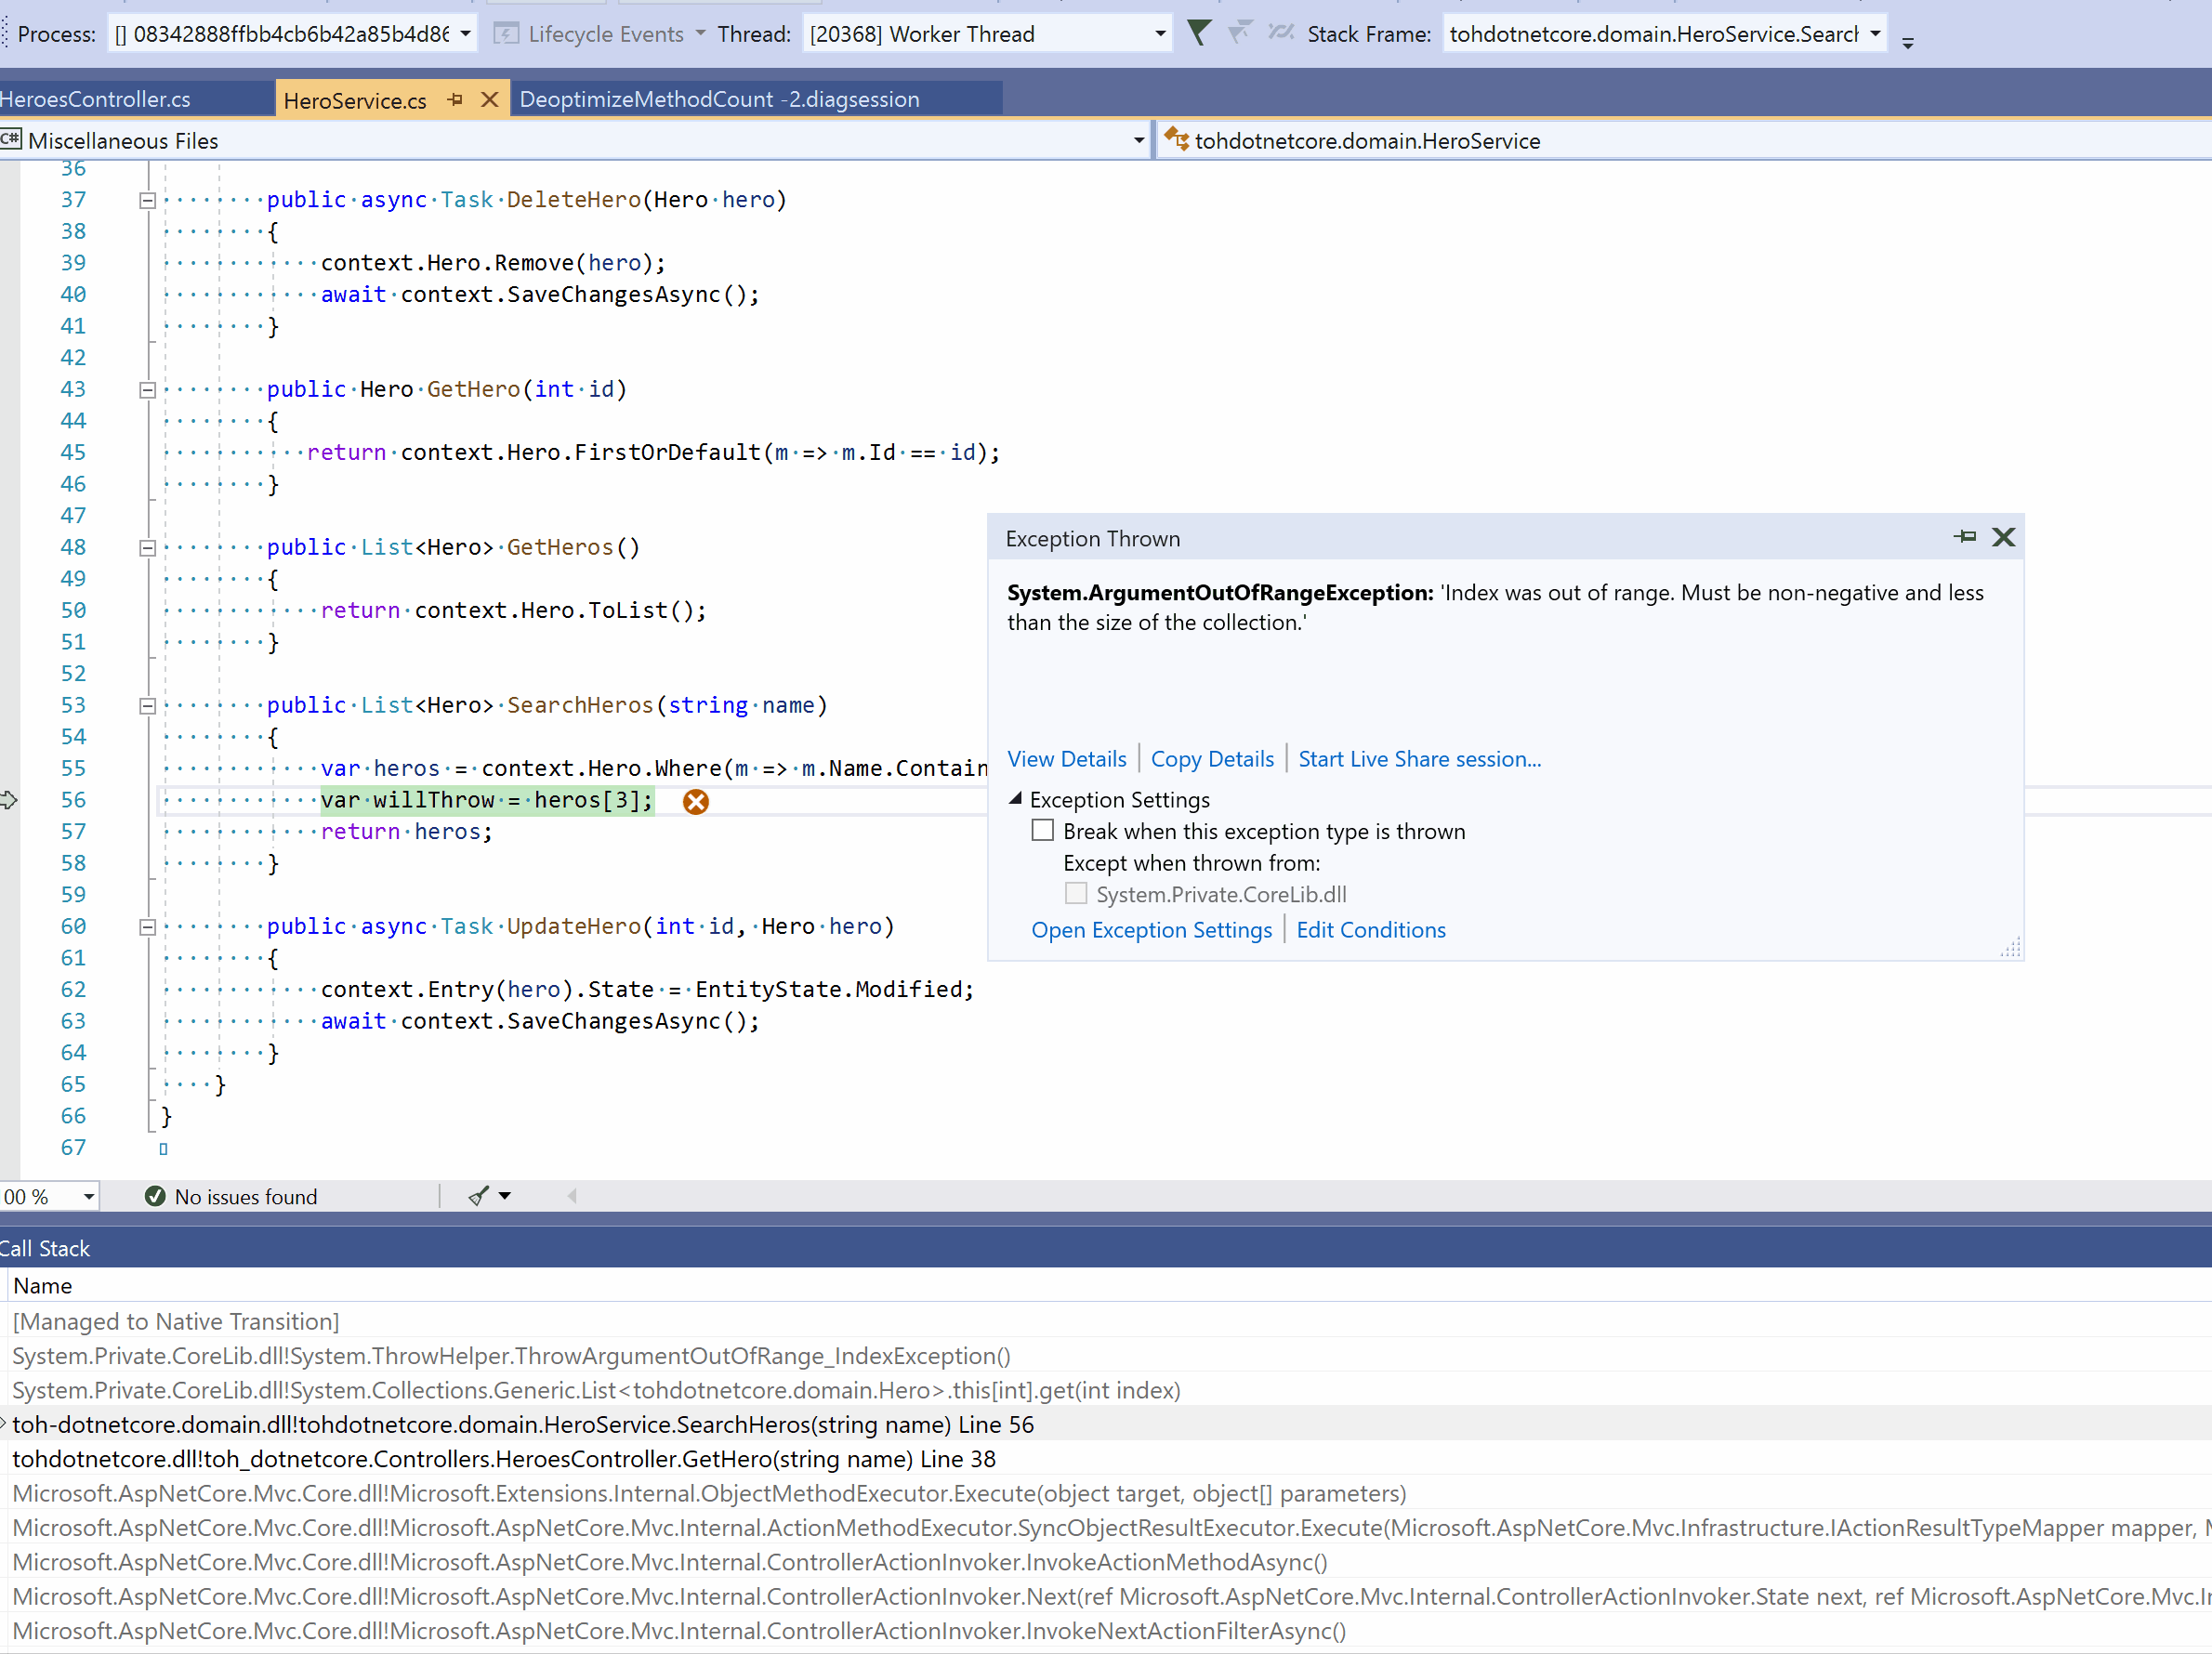
The default value is 1 (setting to 0 completely disables deoptimization), meaning you will only have deoptimization at the first level of your exception, for instance below an exception is thrown and there is only visibility at the first level of the call stack.
This is valuable, but it suddenly loses value if you need further variable information down the stack. By increasing the configuration value we get access to variable farther down the call stack.
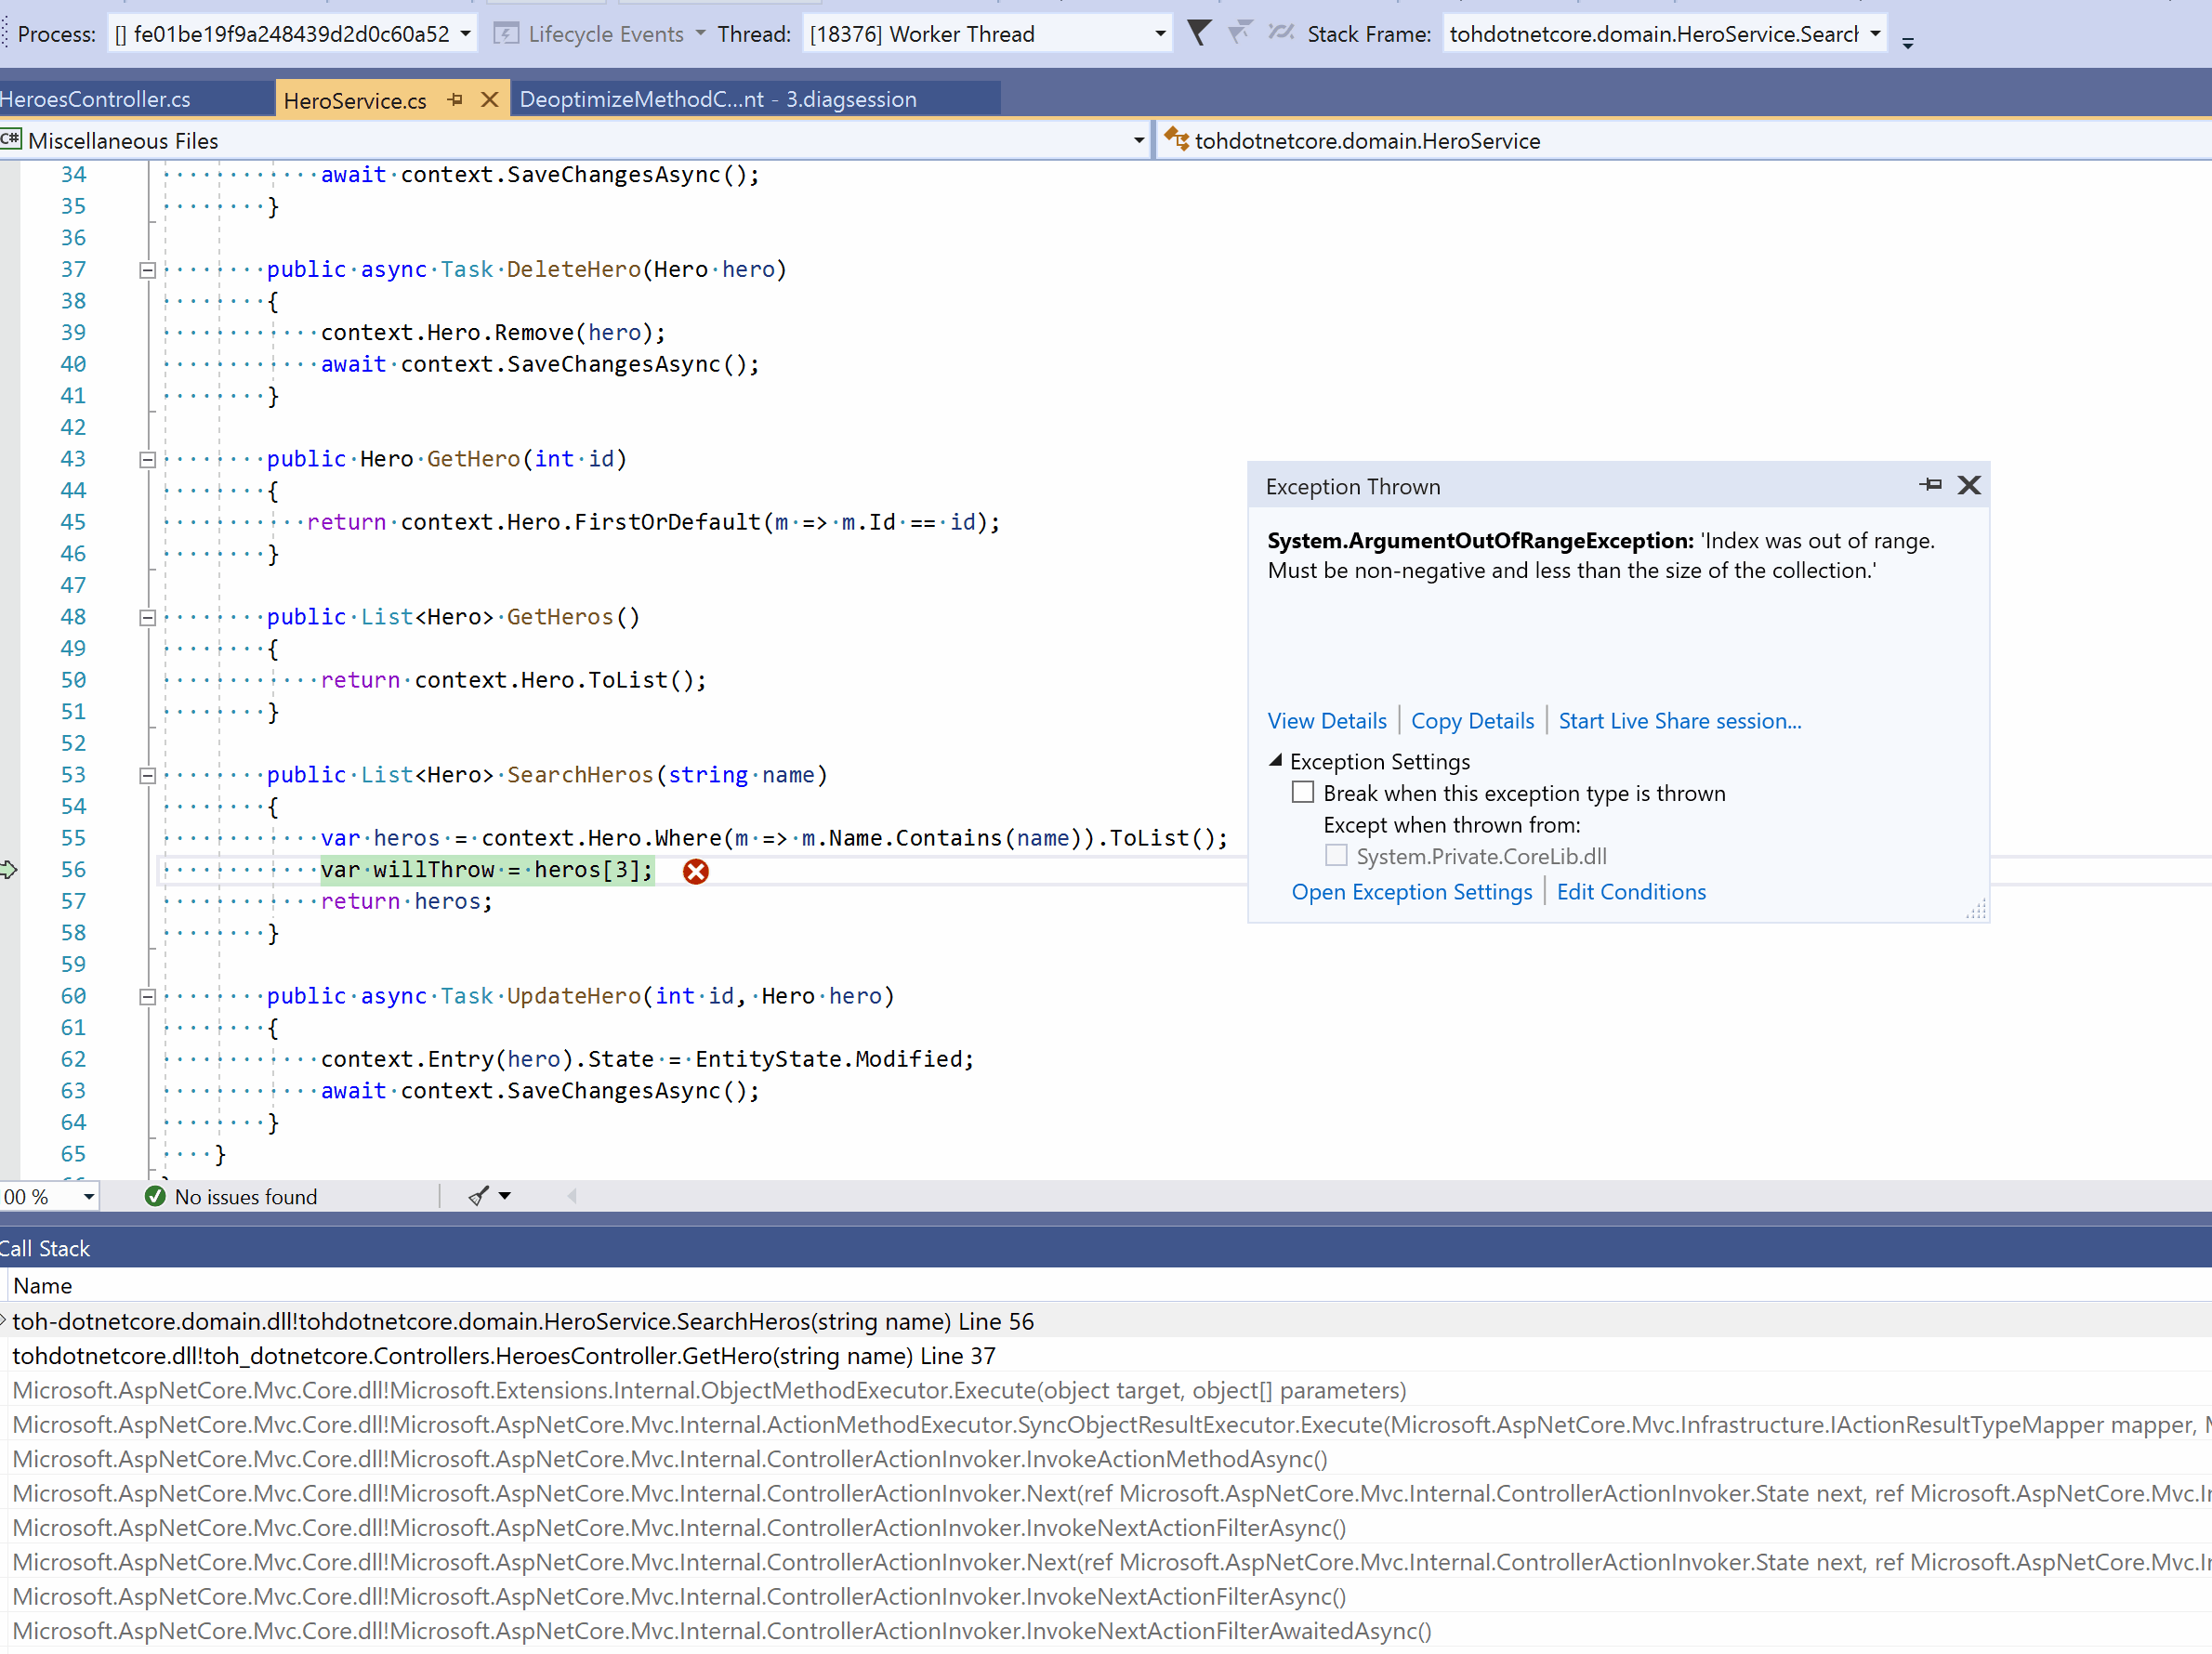
This is really valuable now since we can manage how deep we need to be able to dive in the call stack to triage issues. One thing to note is that this setting does come with performance impact. It would not be noticeable for shallow diving in the stack, but expect performance degradation if that setting is high.
Be sure to let me know what you think of the feature. I will update this blog as well when 1.3.5 is out of preview.